


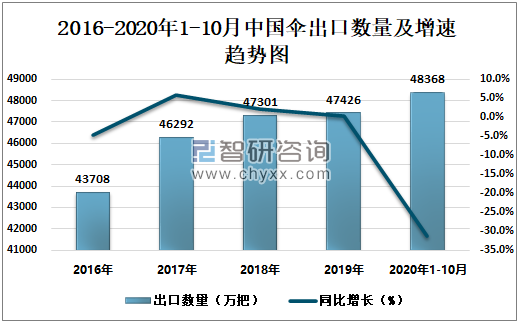
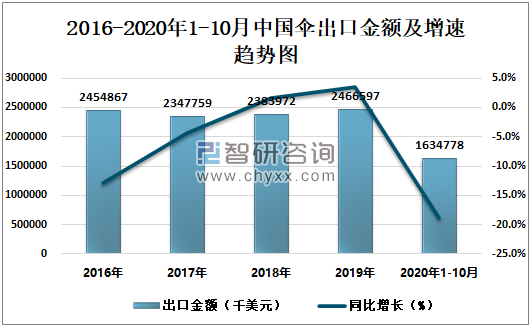
根据中国海关数据显示:2020年1-10月中国伞出口数量为48368万把,同比下降31.3%;2020年1-10月中国伞出口金额为1634778千美元,同比下降18.9%。
近一年中国伞出口数量及出口金额统计表
时间 | 累计出口数量(万把) | 累计出口数量同比增长(%) | 累计出口金额(千美元) | 累计出口金额同比增长(%) |
2019年10月 | 38199 | -0.7 | 2018136 | 3.3 |
11月 | 42119 | -0.9 | 2217149 | 3.1 |
12月 | 47426 | 0.3 | 2466597 | 3.5 |
2020年1-2月 | 9847 | -22.5 | 356202 | -23.0 |
3月 | 15181 | -19.2 | 571973 | -16.3 |
4月 | 19213 | -27.6 | 743970 | -19.3 |
5月 | 23145 | -33.6 | 884122 | -22.6 |
6月 | 28056 | -33.0 | 1048139 | -20.9 |
7月 | 33550 | -32.6 | 1217772 | -19.4 |
8月 | 38441 | -32.6 | 1355061 | -19.3 |
9月 | 43579 | -31.8 | 1491844 | -19.0 |
10月 | 48368 | -31.3 | 1634778 | -18.9 |
数据来源:中国海关,智研咨询整理
2016-2020年1-10月中国伞出口数量及增速趋势图

数据来源:中国海关,智研咨询整理
2016-2020年1-10月中国伞出口金额及增速趋势图

数据来源:中国海关,智研咨询整理
 智研咨询 - 精品报告

2022-2028年中国伞行业竞争格局分析及投资发展研究报告
《2022-2028年中国伞行业竞争格局分析及投资发展研究报告》共十二章,包含中国伞行业市场竞争格局分析,中国伞行业重点企业竞争力分析,中国伞行业投资分析及建议等内容。
如您有其他要求,请联系:
版权提示:智研咨询倡导尊重与保护知识产权,对有明确来源的内容注明出处。如发现本站文章存在版权、稿酬或其它问题,烦请联系我们,我们将及时与您沟通处理。联系方式:gaojian@chyxx.com、010-60343812。


